
Every programming language that you'll use will have some sort of tool that allows you to debug the code you write.
Without debugging, finding the errors in your code would be VERY time consuming.
The magic of using a debugging tool is that it allows you to run your code line-by-line at a pace that you're comfortable with. This means that the computer won't just FLY through every single line of code and leave you guessing what the heck just happened. Debugging tools will allow you to dissect and inspect every single aspect of your code as it's running.
This is massively useful, as it allows you to spot any potential errors/bugs in a much more human way.
What Tools to Use to Debug in JavaScript
JavaScript is a bit unique as it exists in the browser that you use. So the tools that enable debugging in JavaScript will be different depending on which browser you use.
As I've mentioned before, I would recommend you use either the Google Chrome browser or Mozilla's Firefox browser.
Debugging JavaScript in Chrome and/or Firefox
If you're using Google Chrome, then you've already got the debugging tool built right into your browser, just hit the F12 key (or CMD + OPT + I on a Mac) and you'll see it pop up.
In Google Chrome, it's called the developer tools window and it actually gives you more than just the ability to debug your JavaScript code. It also allows you to inspect pretty much any aspect of any webpage you visit. But to stay on topic, I'll only talk about debugging.
I've actually done something special for this tutorial and I've included a JavaScript file, which you will be able to use as a debugging example. Aren't I so thoughtful? This will make it easier to explain the steps involved in debugging.
So, to start debugging the JavaScript file I've included in this blog post, follow these steps:
- If it's not already open, hit F12 (or CMD + OPT + I on a Mac) to open the Dev Tools

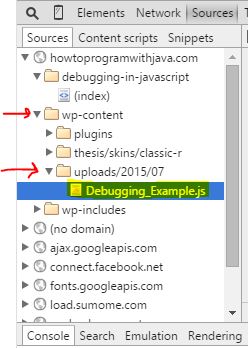
- Click on the Sources Tab
- Navigate to the “Debugging_Example.js” file via the “wp-content/uploads/2015/07” folder and click on the JS file. Note: If this website is using caching (From a CDN) then you may need to access this JS file from an entry that starts with
htpwj-zone...

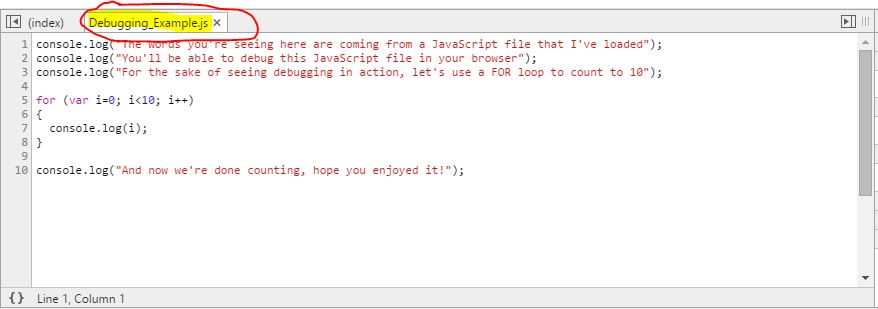
- Notice that it opens a “Debugging_Example.js” tab in the main window
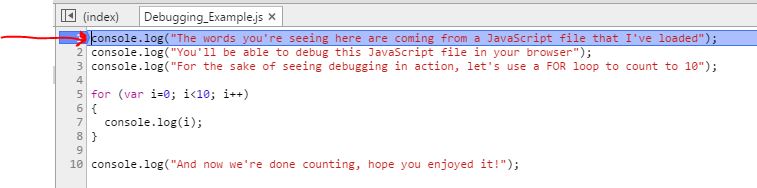
- Now click on any of the line numbers (on the left side) to add a breakpoint. This is where the code will “pause” so you can debug line by line.
- Then you'll need to refresh the page to start the debugging process.
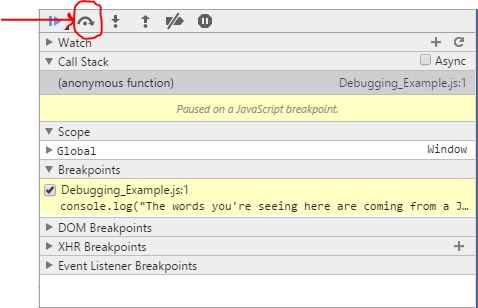
- Once the page refreshes, you'll see that it will “pause” at the breakpoint that you previously inserted.
- Now you can step through the code line-by-line using the “Step Over” icon in the top right of the Dev Tool.


As you step through the code line by line, you'll see that the console messages will appear right when you hit the “step over” icon. Plus you'll get to see exactly how the for loop iterates over your code.
Debugging is not only a handy tool, but it can also serve as an educational tool for learning how the code functions as it's being run.
Debugging in Firefox
Update: When this post was originally written, Firefox didn't have a built in code debugger and you had to download ‘firebug' in order to enable this debugging functionality. This is no longer the case, you should be able to follow the instructions above and still be able to debug with Firefox without installing any additional plugins.
For the sake of completion, I've left the details on how to install the ‘firebug' plugin, just in case you prefer to use it…
Firefox uses a plugin called “Firebug” that will need to be installed. It's very similar to Google Chrome's Developer Tools. To download Firebug, go to this link: https://addons.mozilla.org/en-us/firefox/addon/firebug/, or if that link happens to be dead then just Google “Firefox Firebug” and you'll be sure to find a working link to install the plugin.
Once you've installed the plugin, you can launch it in the same way that you launch the Google Dev Tools, by hitting F12 (or CMD + OPT + I on a Mac).
The beauty about the Developer Tools / Firebug plugin is that they both function in nearly identical ways.
To debug your code using the Firebug plugin in Firefox, just follow the same steps that we've outlined above in the “Debugging in Chrome” section!