

Introduction to Debugging 101
Hey there, fellow coders! Have you ever found yourself staring at your screen in frustration, scratching your head while trying to unravel the mysterious bugs lurking in your code? Trust me, we've all been there. Debugging can feel like embarking on a detective's quest, searching for clues and piecing together the puzzle that is your code. But fear not! In this blog post, we'll embark on a journey into the captivating world of debugging, where we'll equip you with the essential tips and tricks to become a master troubleshooter.
Before we dive into the details of this post, if you're feeling the itch to sharpen your debugging skills and are seeking a structured program with live teaching, we invite you to apply to our 14-day challenge. This immersive experience will provide you with expert guidance, hands-on practice, and the opportunity to collaborate with fellow learners. It's the perfect complement to this blog post and will take your debugging abilities to the next level. Join us in the challenge and let's embark on this exciting journey together!
Picture this: You've just poured your heart and soul into crafting what you thought was the perfect code. Excitement fills the air as you eagerly hit that run button, anticipating the flawless execution of your creation. But alas, the unexpected occurs. An error message pops up, mocking your efforts. Your excitement dissipates, replaced by a mix of confusion and frustration. It's in these moments of uncertainty that the true test of a coder begins.
The art of debugging is not merely about fixing broken code; it's a mindset. It's about embracing the challenges, the setbacks, and the perplexing bugs as opportunities for growth. It's about approaching each issue with curiosity, determination, and a dash of creativity. Debugging is where the true magic of coding happens—it's where problems are solved, solutions are found, and breakthroughs are made.
Throughout this blog post, we'll dive deep into the fundamentals of debugging. We'll unravel the common mistakes that plague developers, introduce you to powerful tools and techniques, and guide you through a systematic approach to tackling bugs. Whether you're a seasoned programmer or just starting your coding journey, this guide will arm you with the knowledge and confidence to face any bug head-on.
So, grab your detective hat, dust off your magnifying glass, and get ready to uncover the secrets of debugging mastery. Prepare yourself for a thrilling adventure filled with aha moments, triumphs, and the satisfaction of conquering those elusive bugs. Get ready to level up your troubleshooting skills and become the hero of your code!
Stay tuned as we unravel the mysteries of debugging in the upcoming sections of this blog post. Your journey to becoming a master troubleshooter begins now!
P.S. Can you spot the bug in the image above?
Answer: we have an array called numbers that contains five elements. However, when iterating over the array using a for loop, the loop condition mistakenly uses i <= numbers.length instead of i < numbers.length. This causes the loop to attempt accessing an element beyond the array's bounds, resulting in an ArrayIndexOutOfBoundsException at runtime.
To fix the code, you need to adjust the loop condition to ensure that it stays within the bounds of the array. In this case, you can change i <= numbers.length to i < numbers.length. Here's the corrected code:
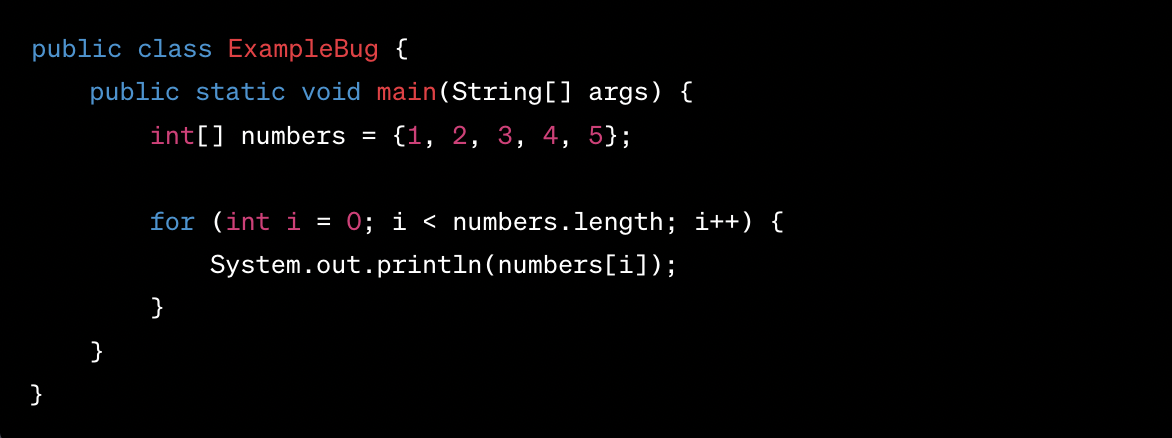
By modifying the loop condition to i < numbers.length, the loop will iterate over the elements in the numbers array from index 0 to index numbers.length - 1, inclusive. This ensures that the loop stays within the bounds of the array and avoids the ArrayIndexOutOfBoundsException.
Once you make this change, the code should execute correctly, printing the numbers 1, 2, 3, 4, and 5 to the console.
Understanding the Importance of Debugging
In the world of coding, debugging is not just a mundane task that comes after writing code—it's a vital part of the development process. It plays a crucial role in ensuring the quality and functionality of your software. Understanding the importance of debugging is the first step towards becoming a proficient developer.
At its core, debugging is all about identifying and resolving issues in your code. It's like shining a light in the dark corners of your program, uncovering the bugs that lurk within. By diligently debugging your code, you can catch errors, address logical flaws, and optimize performance. The ultimate goal? To deliver cleaner, more efficient code that runs smoothly and meets the desired specifications.
One of the primary benefits of debugging is its ability to save time and effort in the long run. By detecting and fixing bugs early on, you can prevent them from snowballing into more significant problems down the line. Imagine the frustration of spending hours or even days building a complex application, only to discover a critical bug that brings everything to a screeching halt. With effective debugging practices in place, you can nip those issues in the bud, ensuring smoother development and faster delivery of your projects.
Debugging also enhances your problem-solving skills. It challenges you to think critically, analyze code behavior, and trace the root causes of issues. As you dive deep into the code, you'll develop a keen eye for spotting patterns, recognizing common pitfalls, and understanding the intricacies of your programming language. These skills not only help you solve immediate problems but also empower you to write better code from the start, reducing the likelihood of encountering similar issues in the future.
Moreover, mastering the art of debugging fosters a sense of confidence and professionalism in your coding journey. It demonstrates your commitment to producing high-quality software and your ability to handle challenges effectively. Clients, employers, and peers will appreciate your attention to detail, your dedication to delivering bug-free code, and your aptitude for resolving issues promptly.
So, as you embark on your coding journey, remember the significance of debugging. Embrace it as an integral part of your development process and make it a priority. By recognizing its importance, you'll be motivated to invest time and effort into mastering this skill, paving the way for cleaner code, improved performance, and greater success in your coding endeavors.
Stay tuned for the upcoming sections, where we'll delve into practical tips and strategies to help you become a debugging maestro!
Approaching Debugging Methodically
Debugging can sometimes feel like navigating through a labyrinth of code, searching for the elusive bug that's causing all the trouble. But fear not! We're here to guide you through a systematic approach to debugging, breaking down the process into manageable steps that will make the task less daunting.
The first step is to reproduce the bug consistently. This involves identifying the specific conditions or inputs that trigger the issue. By replicating the problem consistently, you can gain better insights into its nature and behavior, which is crucial for effective debugging.
Once you have a reproducible case, it's time to isolate the problematic code. Narrow down the scope of your investigation by identifying the specific lines or functions that are causing the bug. Use logging statements, breakpoints, or other debugging tools to gain visibility into the code execution and track the flow of data.
Next, it's important to analyze the relevant variables and data structures. Examine their values, track their changes, and compare them to the expected outcomes. By understanding how the data behaves, you can uncover discrepancies and identify potential sources of the bug.
Another valuable technique is to employ the divide-and-conquer strategy. Break down your code into smaller components and test them individually. This helps identify whether the bug is localized to a specific module, function, or block of code. By gradually narrowing down the scope, you can home in on the problematic section more efficiently.
Throughout the debugging process, make use of appropriate debugging tools and techniques. Integrated development environments (IDEs) often provide features like breakpoints, watches, and step-by-step execution, which can greatly aid your debugging efforts. Additionally, logging frameworks and error tracking tools can help you capture valuable information about the bug and its context.
Approaching debugging methodically not only streamlines the process but also improves your chances of finding and resolving issues effectively. So, embrace this systematic approach and apply it to your debugging endeavors. By following a clear framework and breaking down the problem into manageable steps, you'll become a more proficient debugger and conquer those bugs with confidence!
Common Mistakes to Watch Out For
In the world of coding, even the most seasoned developers can fall into common traps that lead to bugs and unexpected behavior. By familiarizing yourself with these frequent coding mistakes, you'll be better equipped to identify potential problem areas in your code and mitigate them effectively.
One common mistake to watch out for is syntax errors. These occur when the code violates the rules of the programming language, resulting in syntax-related issues. Misplaced parentheses, missing semicolons, or incorrect function calls are just a few examples. Fortunately, modern development environments often provide helpful error messages that can guide you in pinpointing and correcting these syntax errors.
Logic errors are another type of mistake that can be tricky to spot. These errors occur when the code's logic or algorithm produces incorrect results. It could be a misplaced conditional statement, an incorrect loop iteration, or an unintended logical operation. Debugging logic errors requires careful examination of the code's execution flow and the logic behind it. Tools like print statements or debuggers can assist in tracing the program's behavior and identifying the faulty logic.
Incorrect variable assignments are yet another common pitfall. Assigning values to variables incorrectly, using the wrong data type, or forgetting to update a variable can lead to unexpected results and bugs. It's crucial to review your code and ensure that variables are assigned and used appropriately throughout the program.
By understanding these common coding mistakes and being mindful of them, you can proactively prevent many bugs from occurring. Take the time to review your code for syntax errors, double-check your logic, and verify that variable assignments are correct. With practice and attention to detail, you'll become adept at spotting and fixing these issues, ensuring cleaner and more robust code.
Remember, debugging is not just about fixing bugs but also about preventing them in the first place. By staying vigilant and mindful of common coding mistakes, you'll pave the way for smoother development and more reliable software.
Essential Debugging Tools
When it comes to debugging code, having the right tools at your disposal can make a world of difference. These tools can streamline the troubleshooting process, help you identify and fix bugs faster, and ultimately improve the quality of your code. Let's explore some essential debugging tools that every developer should be familiar with.
Integrated Development Environments (IDEs) are powerful software tools that provide a comprehensive development environment. IDEs such as Visual Studio Code, PyCharm, or Eclipse come equipped with advanced debugging features. They allow you to set breakpoints, step through your code line by line, inspect variables, and analyze program flow. Learning to leverage the debugging capabilities of your preferred IDE can significantly enhance your ability to identify and resolve issues efficiently.
In addition to IDEs, there are other debugging techniques and tools you can use. One simple yet effective approach is the strategic use of print statements. By strategically placing print statements in your code to output specific values or checkpoints, you can gain insights into the program's execution and identify areas where bugs might be occurring.
Logging is another invaluable tool for debugging. By incorporating logging statements into your code, you can record important events, variable values, and error messages during the program's execution. These logs can help you trace the flow of your code, identify problematic areas, and understand the sequence of events leading to a bug.
Code analyzers and linters are tools that analyze your code for potential issues, such as syntax errors, unused variables, or common programming mistakes. These tools can catch bugs and provide suggestions for improvement even before you run your code. Popular examples include Pylint, ESLint, and RuboCop.
By familiarizing yourself with these essential debugging tools, you'll have a toolkit at your disposal to tackle bugs more effectively. Whether it's using the debugging features of your IDE, strategically adding print statements, incorporating logging, or leveraging code analyzers, these tools will empower you to troubleshoot your code with confidence.
Strategies for Effective Debugging
Debugging code can be a complex and sometimes frustrating process, but with the right strategies and techniques, you can streamline the debugging process and overcome even the most challenging bugs. Here are some practical strategies to help you debug your code effectively.
One of the most powerful debugging techniques is the use of breakpoints. Breakpoints allow you to pause the execution of your code at specific points, giving you the opportunity to inspect variables, evaluate expressions, and step through the code line by line. By strategically placing breakpoints in areas where you suspect issues might occur, you can narrow down the problem and gain valuable insights into the state of your program.
Stepping through code is another essential technique. This involves executing your code line by line to understand its flow and identify any unexpected behavior. By observing the changes in variables and the execution path, you can pinpoint the exact location where the bug is occurring.
Divide-and-conquer is a helpful strategy for tackling complex bugs. Instead of trying to debug the entire codebase at once, break it down into smaller sections or functions. By systematically eliminating sections that are working correctly, you can focus your efforts on the specific area where the bug is likely to be present.
Another effective strategy is to isolate the problematic code. This involves commenting out or temporarily removing sections of code to identify the source of the bug. By gradually reintroducing the code, you can narrow down the cause of the issue and find a solution.
It's also crucial to pay attention to error messages and take advantage of logging. Error messages often provide valuable clues about the nature of the problem. By analyzing these messages and incorporating logging statements into your code, you can gather additional information that helps you pinpoint the cause of the bug.
By implementing these strategies, such as using breakpoints, stepping through code, employing divide-and-conquer, and isolating problematic code, you'll be equipped with effective techniques to tackle bugs with confidence. Remember, debugging is a skill that improves with practice, so don't get discouraged and keep honing your debugging abilities.
Tips for Debugging Web Applications
Debugging web applications can be a challenging task due to their distributed nature and the numerous layers involved. However, with the right approach and tools, you can effectively troubleshoot and fix issues in your web applications. Here are some valuable tips to help you debug web applications more efficiently:
- Use browser developer tools: Modern web browsers come equipped with powerful developer tools that provide insights into your application's behavior. Utilize features like the JavaScript console, network monitor, and element inspector to examine network requests, JavaScript errors, and HTML structure. These tools enable you to inspect and manipulate your web application in real-time.
- Check the browser compatibility: Cross-browser compatibility issues can often lead to unexpected bugs. Test your web application on different browsers and versions to identify any browser-specific problems. Use tools like BrowserStack or Sauce Labs to simulate various browser environments and ensure your application works as expected across different platforms.
- Use console.log(): Inserting console.log() statements strategically throughout your code can help you track the flow of data and identify potential issues. By logging relevant variables, function calls, and error messages, you can gain valuable insights into the state of your application and pinpoint problematic areas.
- Employ error handling and logging: Implement proper error handling mechanisms in your web application to capture and log any errors that occur. Use tools like Sentry or LogRocket to gather comprehensive error logs and stack traces. This information can assist you in identifying the root cause of errors and fixing them more efficiently.
- Leverage browser extensions and plugins: There are several browser extensions and plugins available that can enhance your debugging experience. Tools like React Developer Tools, Redux DevTools, or Vue.js Devtools provide specific debugging functionalities for popular frameworks. Install these extensions to gain deeper insights into the inner workings of your web application.
- Test in different environments: Debugging web applications should involve testing in various environments, such as development, staging, and production. Differences in configurations and dependencies between environments can often lead to bugs. Reproduce issues in different environments to identify the specific factors causing the problem.
By following these tips and leveraging the appropriate tools, you can streamline the debugging process for your web applications and ensure they perform optimally across different browsers and environments. Remember to approach debugging systematically, analyze error messages, and make use of the available developer tools to uncover and resolve issues effectively.
Conclusion
If you've read this far, congratulations. It's not easy reading a blog post on debugging, it's not one of my “sexiest” topics yet. We have tons of other blog posts that will be easier reads.
Debugging web applications can be particularly challenging due to their complex nature, but with the tips mentioned, you can navigate through the intricacies and identify and resolve issues more efficiently. Remember to leverage browser developer tools, check for browser compatibility, use console.log() strategically, implement error handling and logging, explore browser extensions, and test in different environments.
As you embark on your journey to become a master debugger, I encourage you to put your skills to the test. We have an exciting 2-week challenge coming up where you'll have the opportunity to apply your newfound knowledge and compete with fellow developers. Get ready to debug your way to victory and showcase your troubleshooting prowess.
Debugging may seem like a daunting task, but with practice and perseverance, you can develop a keen eye for spotting bugs and a systematic approach to resolving them. Embrace the challenge, learn from each debugging experience, and never hesitate to seek help from the developer community.
So, roll up your sleeves, sharpen your debugging skills, and get ready to conquer the world of troubleshooting. With determination and the right strategies, you'll become a debugging maestro, capable of taming even the most elusive bugs. Happy debugging!